I am very interested in
the weather, mainly from the viewpoint of receiving images from weather satellites,
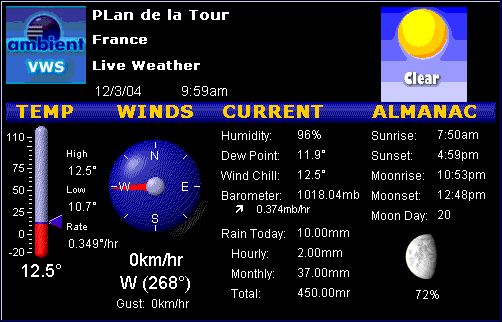
but also collecting my own weather data and trying to interpret it. I have a
weather station which measures most of the normal weather items on a continuous
basis and these are logged to a file on the computer. The computer program produces
an output on the screen showing what is going on. A sample of this is shown
below. Note that this is not necessarily up to date, as I have not yet automated
the transfer of the data from home to the web site.
 Click here for a monthly weather summary.
Weather Satellite Image Reception
There are two types
of weather satellite: those in geostationary orbit and those in polar orbit.
The former orbit at about 35,000 km above the earth, and appear to stay motionless
in the sky, so they see the same view of the world every day. Polar orbiters,
in contrast, orbit at about 900 km altitude, over the poles, so their view of
the earth is more restricted and changes all the time.
The signal from the geostationary satellites
that I receive is called WEFAX (WEather
FAX), and that from the polar satellites
APT (for
automatic picture transmission). WEFAX images can be animated by the software
to show the progress of weather systems over several days. Click here
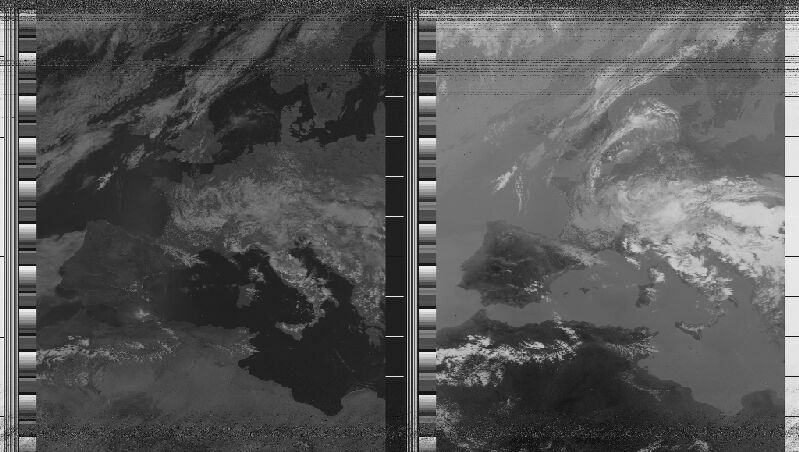
for a sample infra-red WEFAX image. Click here
for a sample APT image, which shows both visible light and infra-red
images side-by-side.
The receiving station can receive both signals simultaneously, but not process them. Normally, I receive WEFAX images from the European satellite Meteosat
7, located at 0 degrees longitude over the equator. When I wish to receive a
polar orbiter such as NOAA 15 or 16, I have to manually set the system to do
so, usually just before the predicted pass of the satellite.
Many people with this hobby suffer from
interference when
trying to receive the weather satellite signals, which are very weak.
I had this problem severely when living in Canada and subsequently wrote an
article on my experiences on how to identify the source of the interference.
Click here to
see this article. Note that some of the images in this article may take a while
to load. Happily, I rarely experience interference here in Plan de la Tour,
although some is visible on the APT image mentioned above.